How To Track Review Student Progress in Learndash?
If you run an eLearning platform with LearnDash, tracking student progress in LearnDash is critical for measuring learning outcomes, improving course performance, and boosting engagement. While LearnDash provides basic reporting features, to get detailed insights, we highly recommend using plugins like:
✅ LearnDash ProPanel – Official LearnDash add-on for real-time reporting and learner tracking.
✅ WISDM Reports for LearnDash – Advanced analytics plugin offering visual dashboards and exportable reports.
These tools take LearnDash reporting to the next level, giving you a clear picture of learner behavior and performance.
In this article, we’ll review all the student progress tracking features in LearnDash, explain how they work, and why ProPanel or WISDM Reports are the best options to use
- LearnDash Review: Student Progress at a Glance
- ✅ Which reports can we track for Students in LearnDash?
- 1. Student Dashboard Counter Blocks
- 2. Revenue from Courses From Students
- 3. Daily Enrollments Of Students in LearnDash
- 4. Course Completion Rate of students in LearnDash
- 5. Course Progress Rate For Students in LearnDash
- 6. Time Spent on a Course by Students
- 7. Quiz Completion Rate of Students in LearnDash
- 8. Learner Pass/Fail Rate of students in LearnDash
- 9. Average Quiz Attempts by Students
- 10. Inactive Users in LearnDash
- 11. Learner Activity Log
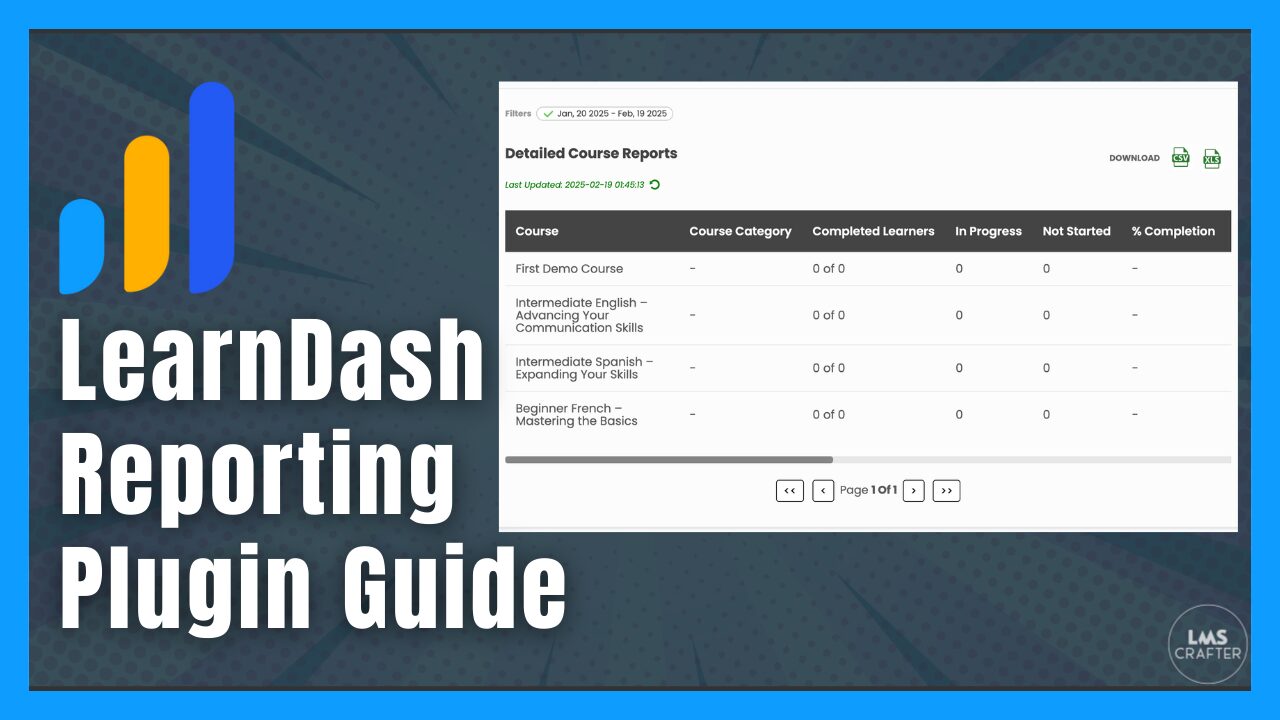
- 12. Detailed Course List (Course Reports)
- 13. Quiz Reports
- Ready to Get Started?
- Wrapping It Up
LearnDash Review: Student Progress at a Glance

✅ Which reports can we track for Students in LearnDash?
The LearnDash Reporting Plugin is a comprehensive tool that offers a variety of detailed reports. Here’s a quick list of the reports you can generate:
- Dashboard Counter Blocks
- Revenue from Courses
- Daily Enrollments
- Course Completion Rate
- Course Progress Rate
- Time Spent on a Course
- Quiz Completion Rate
- Learner Pass/Fail Rate
- Average Quiz Attempts
- Inactive Users
- Learner Activity Log
- Detailed Course List (Course Reports)
- Quiz Reports
Let’s explore each of these reporting features in detail.
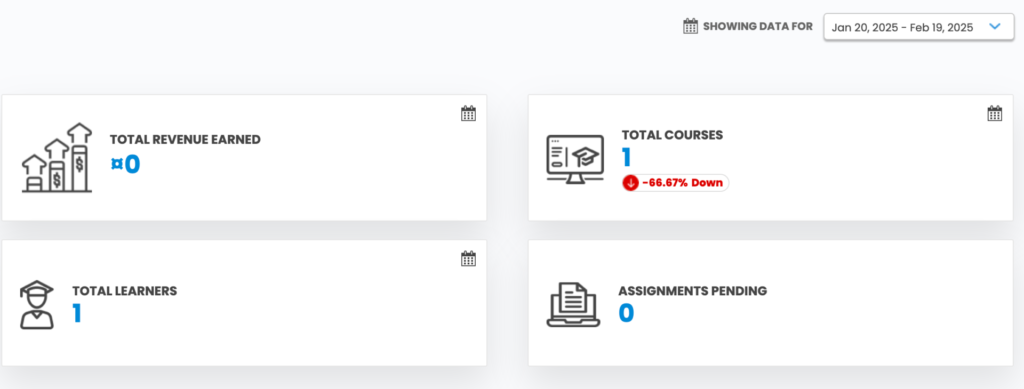
1. Student Dashboard Counter Blocks
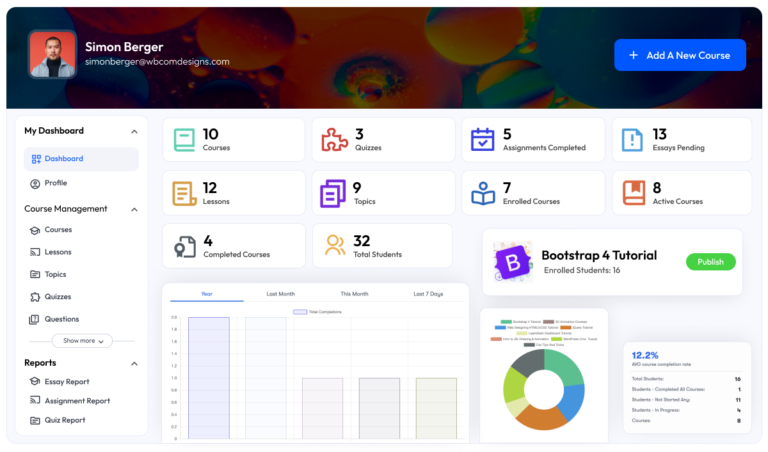
When you log in, the LearnDash Reporting Plugin immediately presents you with quick stats at the top of your dashboard:
- Total Revenue: Your overall course earnings within a selected time frame.
- Total Courses: The number of active courses on your platform.
- Total Learners: New sign-ups or enrollments captured during the reporting period.
- Pending Assignments: A count of assignments awaiting review.
Why It Matters:
These counters are your daily check-in—like a morning briefing that lets you instantly gauge the health of your eLearning platform. If any metric seems off, you know it’s time to dig a little deeper.
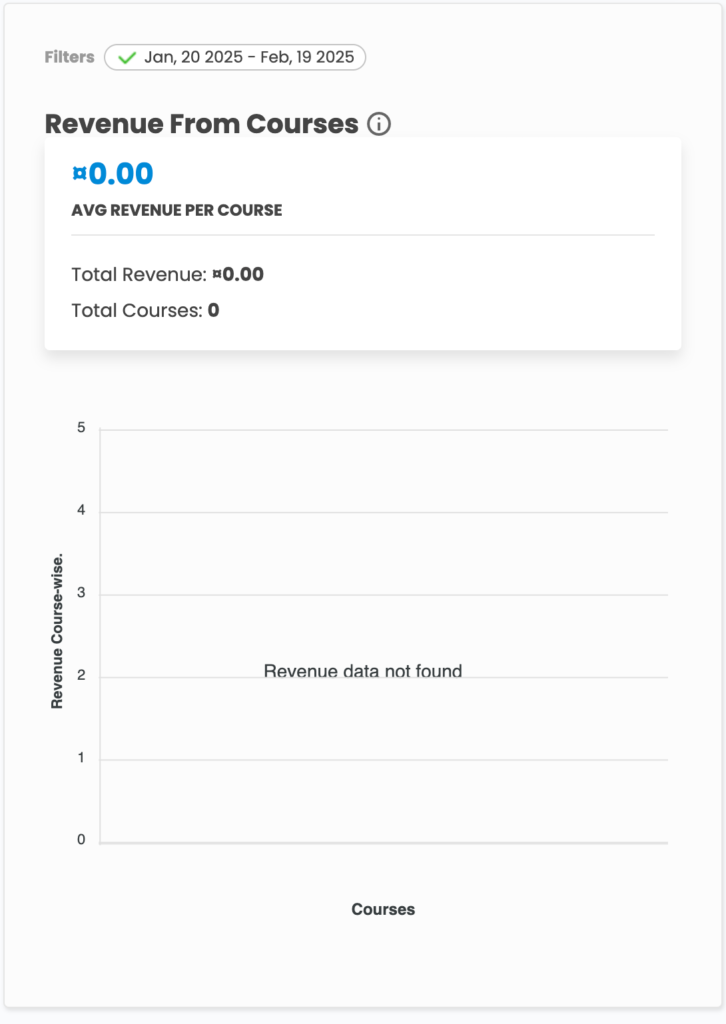
2. Revenue from Courses From Students
This section features a clear, visual chart that tracks your revenue over time.
- Flexible Date Filters: View earnings by day, week, or month.
- Performance Comparison: Compare your current earnings to previous periods.
- Top-Earning Courses: Identify which courses are generating the most income.
Why It Matters:
Understanding revenue trends helps you pinpoint which courses are the real money-makers and which might need a content update or extra marketing.
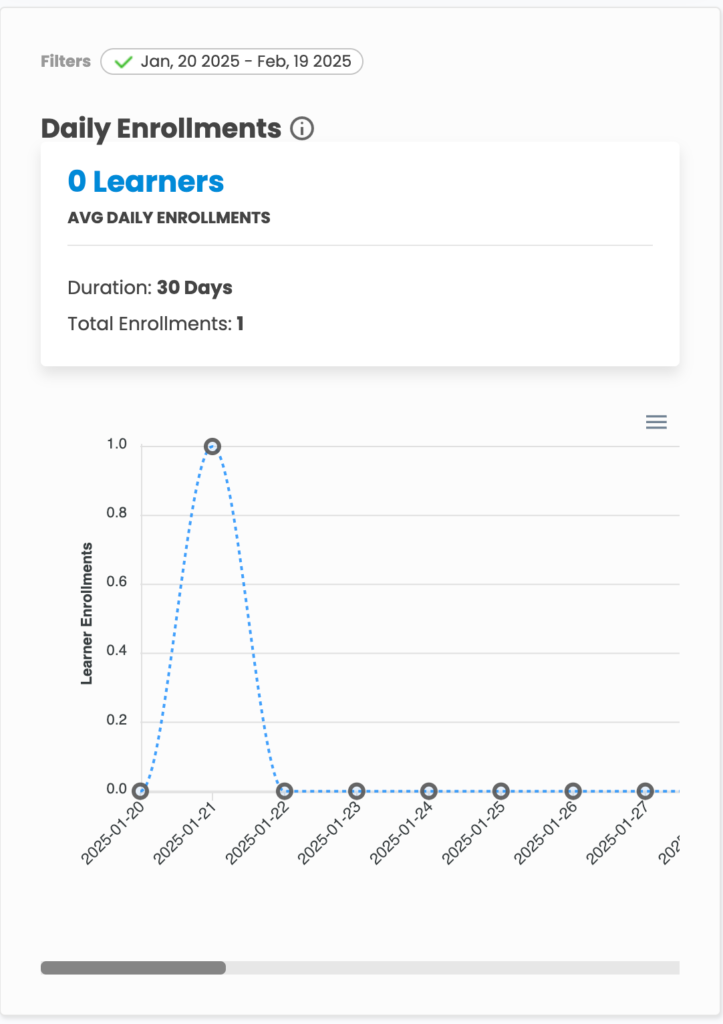
3. Daily Enrollments Of Students in LearnDash
A dynamic line chart displays the number of new enrollments each day.
- Trend Tracking: Observe daily enrollment patterns to see the impact of promotions or seasonal shifts.
- Average Enrollments: Get an idea of your platform’s typical daily performance.
Why It Matters:
Daily enrollment data helps you recognize when your marketing efforts are paying off—and when they might need a boost.
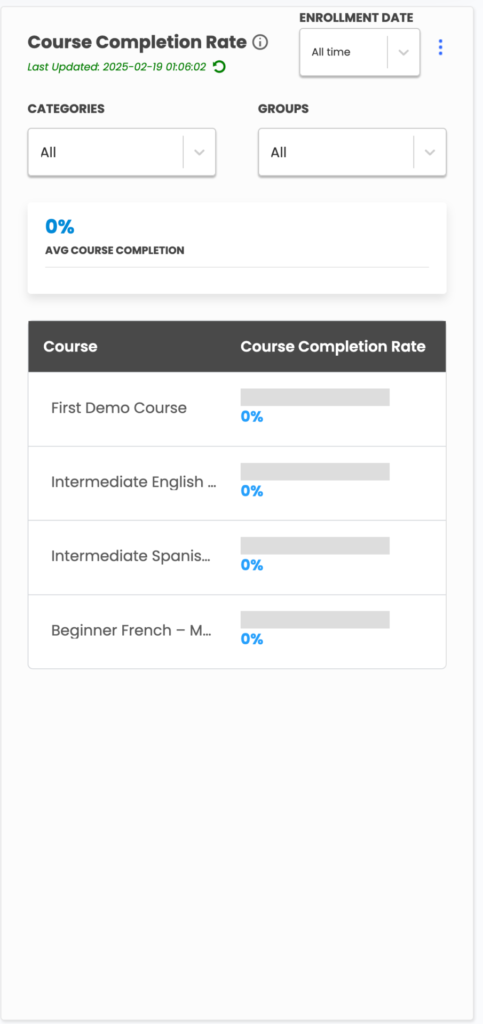
4. Course Completion Rate of students in LearnDash
Shown as a pie or bar chart, this report reveals the percentage of students who finish a course.
- Completion vs. In-Progress: Quickly see how many learners complete a course versus those still working through it.
- Course-Specific Details: Filter by individual course to identify potential issues with content or engagement.
Why It Matters:
A low completion rate might indicate that course content needs reworking to keep students motivated and on track.
5. Course Progress Rate For Students in LearnDash
This feature takes a closer look at how far along your students are in each course.
- Progress Breakdown: See the distribution of students at different progress levels (25%, 50%, 75%, or complete).
- Identify Bottlenecks: Discover if students are consistently stalling at a particular lesson or module.
Why It Matters:
By understanding where learners drop off, you can make targeted improvements to keep everyone moving forward.
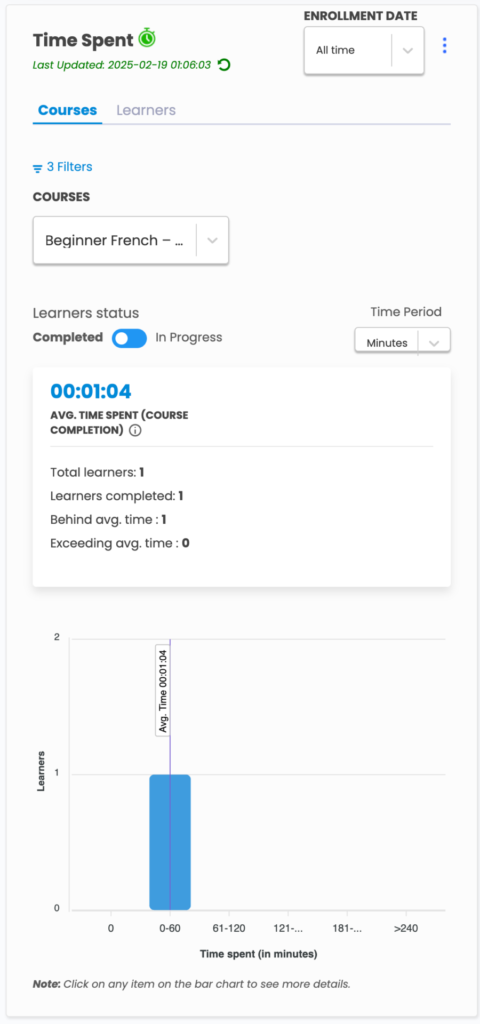
6. Time Spent on a Course by Students
This report shows the average time your students spend on each course, with options to filter out idle time.
- Accurate Engagement Data: Excludes time when students are inactive for a clearer picture of true engagement.
- Per-Learner Analysis: Drill down to see individual learning times.
Why It Matters:
If students are breezing through too quickly or taking far too long, it could indicate issues with course pacing or difficulty.
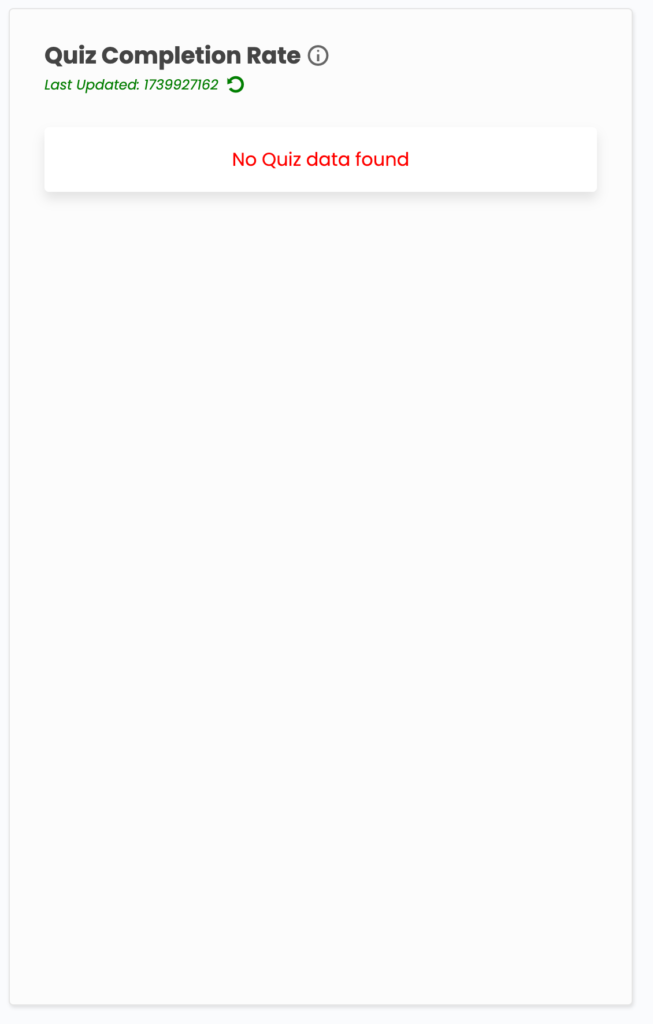
7. Quiz Completion Rate of Students in LearnDash
This section focuses on how many quizzes are completed successfully.
- Completion Insights: Compare the number of quizzes started versus those finished.
- Pass/Fail Metrics: Some views provide additional breakdowns by pass and fail rates.
Why It Matters:
Quizzes are a critical measure of learning. A gap between attempts and completions might signal that your quiz design needs a tweak.
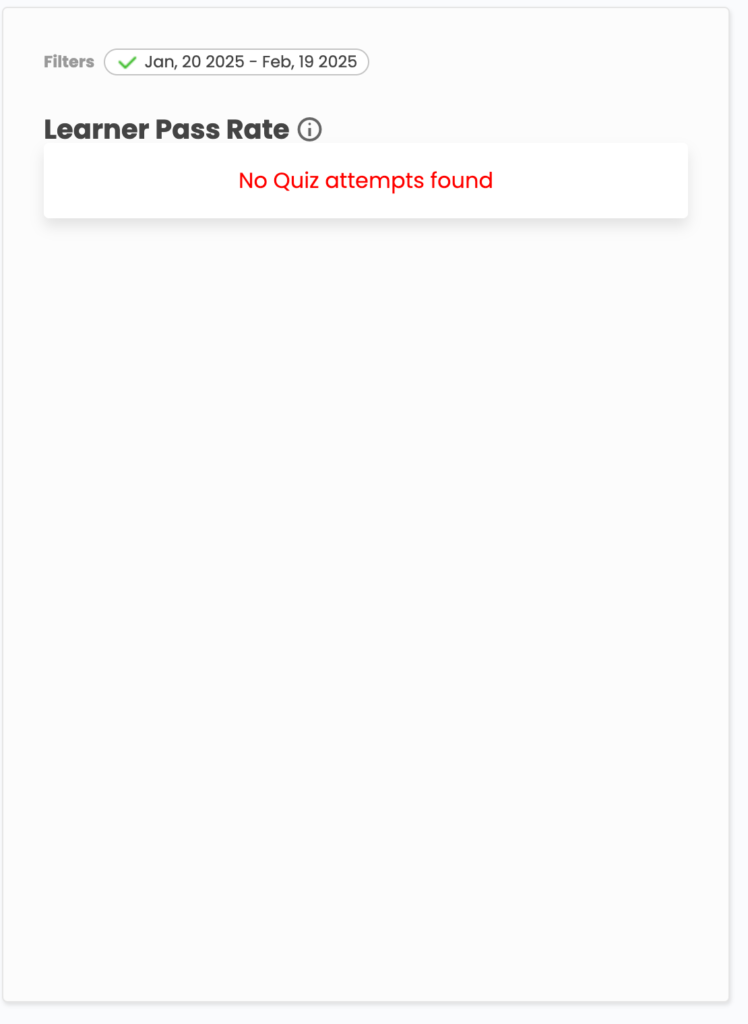
8. Learner Pass/Fail Rate of students in LearnDash
Displayed as a pie chart or percentage bar, this report shows the pass-to-fail ratio for your quizzes.
- Visual Ratio: Instantly see the ratio for each quiz or set of quizzes.
- Course Comparison: Compare performance across different courses.
Why It Matters:
Too many failures may suggest that either your course content or quiz difficulty needs adjusting.
9. Average Quiz Attempts by Students
This metric shows the average number of attempts it takes for learners to pass a quiz.
- Multiple Attempts: Identify if students frequently need several tries.
- Trend Over Time: Track changes in average attempts.
Why It Matters:
Frequent multiple attempts might mean your quiz is too challenging or the preparatory material isn’t clear enough.
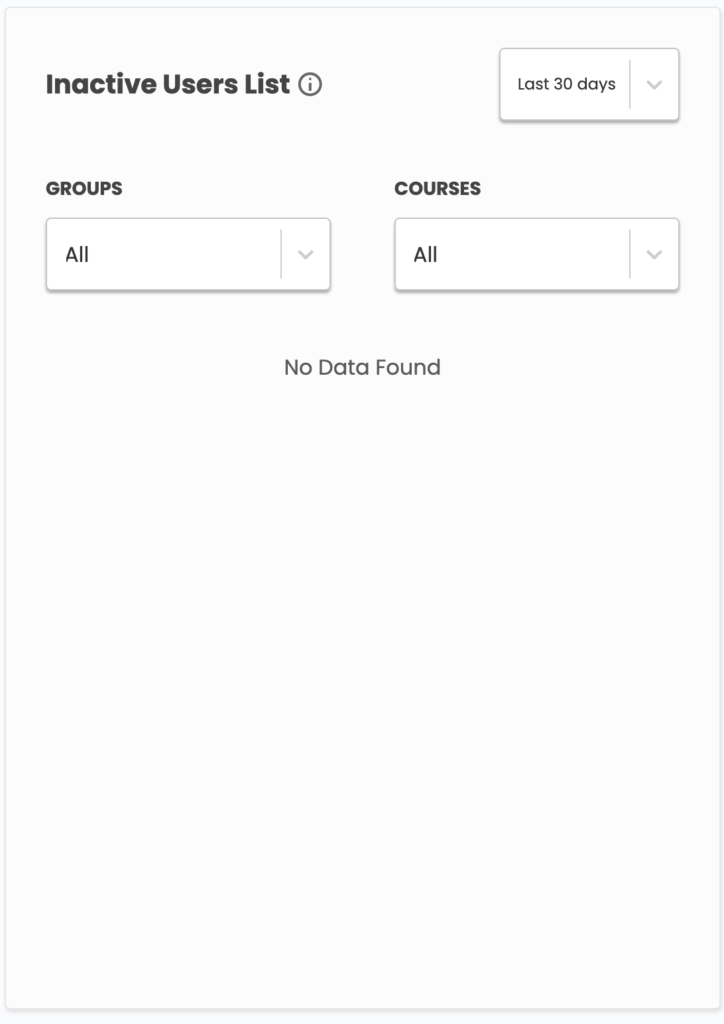
10. Inactive Users in LearnDash
This report highlights users who haven’t logged in or engaged with your content recently.
- Last Active Date: See when a user was last active.
- Re-Engagement Options: Some tools even let you send a friendly “We miss you!” email directly from the dashboard.
Why It Matters:
Reactivating inactive users can dramatically boost your overall engagement and revenue.
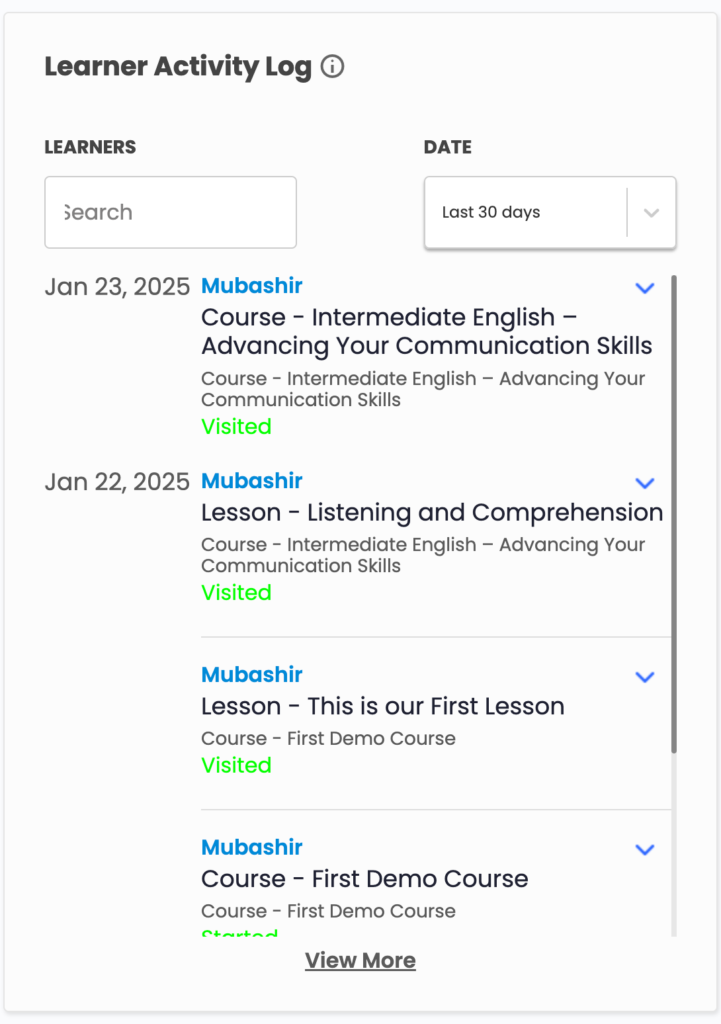
11. Learner Activity Log
Imagine a detailed timeline of every important action a student takes. That’s what the Learner Activity Log offers.
- Comprehensive Record: Track lesson completions, quiz attempts, assignment submissions, and more.
- Troubleshooting Tool: Use it to verify student activity and resolve any discrepancies.
Why It Matters:
This log gives you a complete picture of learner behavior and helps you quickly identify any issues.
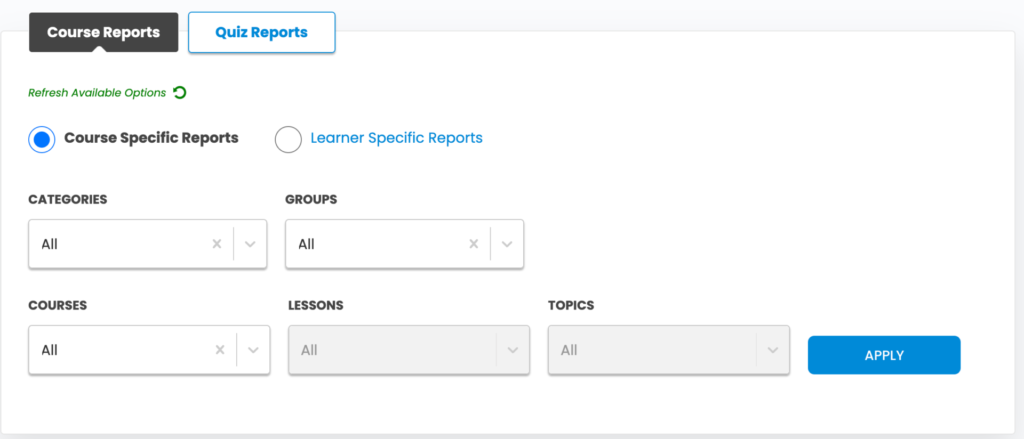
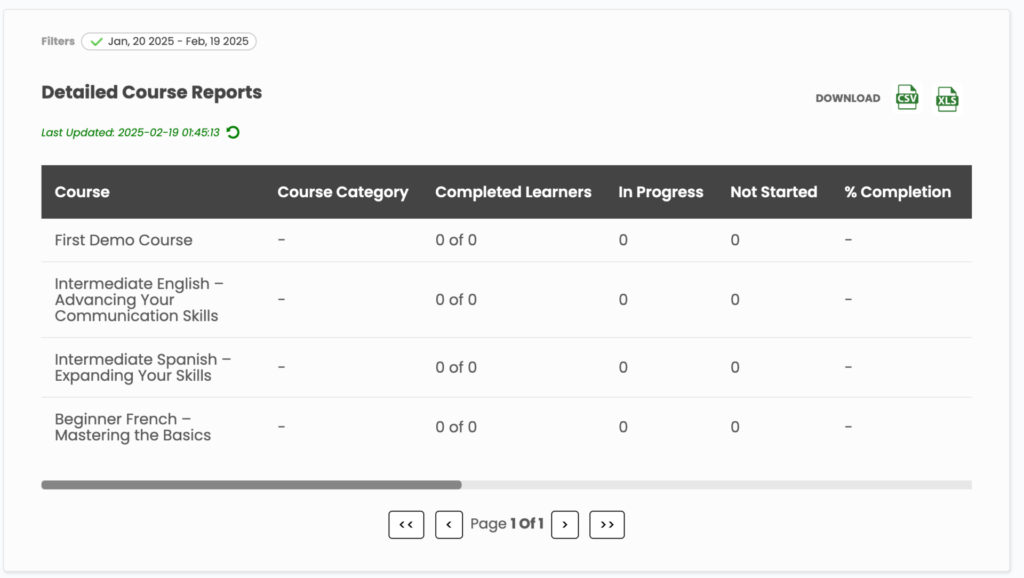
12. Detailed Course List (Course Reports)
Usually presented in a table, this report offers detailed data for each course.
- Key Metrics: Includes course name, enrollments, completion rates, and average scores.
- Export Options: Export the data in CSV or Excel formats for deeper analysis.
Why It Matters:
A detailed course list lets you see which courses are excelling and which may need extra attention.
13. Quiz Reports
This section dives into every aspect of your quizzes for a detailed analysis.
- Question-Level Insights: Identify which questions most students get wrong.
- Time per Attempt: Understand if the quiz timing is effective.
- Individual Performance: Track trends for each learner over multiple attempts.
Why It Matters:
Detailed quiz reports help you refine assessments, ensuring they’re challenging yet fair, and highlight where students may need extra support.
Ready to Get Started?
The LearnDash Reporting Plugin isn’t just a data tool—it’s your secret weapon for unlocking deeper insights and driving course success. Whether you’re tracking revenue, monitoring enrollments, or diving deep into quiz performance, these reports give you the power to make informed, data-driven decisions.
Download the LearnDash Reporting Plugin now using our affiliate link and start transforming your courses today!
Download Now – LearnDash Reporting Plugin
Before you Purchase LearnDash Propanel and See How we can Track student Progress in Learndash, must watch this video.
Wrapping It Up
The LearnDash Reporting Plugin is a game-changer for course creators who want to harness the power of data to boost learner engagement and success. By leveraging these detailed reports—from revenue tracking to quiz analysis—you can make informed adjustments that enhance both course quality and learner satisfaction.
Don’t miss out on the opportunity to turn your data into actionable insights. Download the LearnDash Reporting Plugin using our affiliate link now and start driving your eLearning success today!
FAQ Section
Q: Can I use this plugin with other LMS platforms?
A: No, it’s designed specifically for LearnDash.
Q: Does it support multilingual sites?
A: Yes! Works seamlessly with WPML and Polylang.
Q: How often is data updated?
A: In real-time, so you’re always viewing the latest stats.
If you have any questions or success stories to share, leave a comment below we’d love to hear from you!pent and pass rates, these tools provide everything you need to manage learners effectively.
If you want to boost completion rates, engagement, and course performance, using these reporting tools with LearnDash is a must.

